Monday, September 16, 2013

Academic Scribblers and the History of Inflation-Protected Securities

In most financial and economic analysis, U.S. Treasuries play the role of the "risk-free" asset. They are risk-free to an approximation only. In particular, since Treasury bonds are nominal, and future inflation is not known with certainty, they carry some inflation risk. Treasury inflation-protected securities (TIPS), like Treasuries, are backed by the full faith and credit of the US government, but are also linked to the Consumer Price Index, reducing inflation risk.

TIPS have a surprisingly interesting history, one that is both longer and shorter than you might expect. Though inflation-indexed bonds made a brief-lived appearance in Massachusetts in 1780, they then disappeared for more than two centuries. TIPS were not issued until 1997, at the urging of then Treasury Secretary Robert Rubin. This is the first of a series of posts I will write about inflation-indexed securities. In this post, I describe their history. In future posts I will review the evidence on whether TIPS have lived up to Rubin's claims that they would benefit savers and reduce the government's borrowing costs, as well as exploring other implications of this teenage asset.

The Commonwealth of Massachusetts created the earliest known inflation-indexed bonds in 1780 in the Revolutionary War. Robert Shiller writes, "These bonds were invented to deal with severe wartime inflation and with angry discontent among soldiers in the U.S. Army with the decline in purchasing power of their pay. Although the bonds were successful, the concept of indexed bonds was abandoned after the immediate extreme inflationary environment passed, and largely forgotten until the twentieth century."
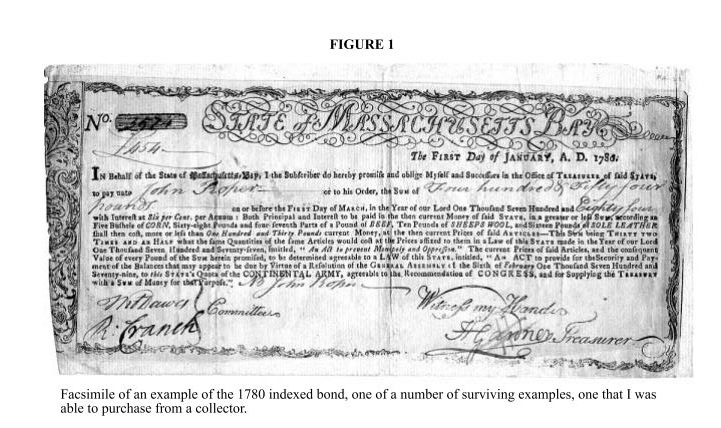
Commonwealth of Massachusetts inflation-indexed bond, 1780, from Shiller (2003).
The 1780 bond reads,
"Both Principal and Interest to be paid in the then current Money of said STATE, in a greater or less SUM, according as Five Bushels of CORN, Sixty-eight Pounds and four-seventh Parts of a Pound of BEEF, Ten Pounds of SHEEPS WOOL, and Sixteen Pounds of SOLE LEATHER shall then cost, more or less than One Hundred and Thirty Pounds current money, at the then current Prices of said ARTICLES—This SUM being THIRTY-TWO TIMES AND AN HALF what the same Quantities of the same Articles would cost at the Prices affixed to them in the Law of this STATE made in the Year of our Lord One Thousand Seven Hundred and Seventy-seven, intitled, 'An Act to prevent Monopoly and Oppression.'"
Thus, the bond functioned similarly to today's TIPS, which are also linked to the price of a market basket of goods (the CPI). Shiller notes that the price index described on the 1780 bond increased 32-fold in three years. The inflation-linked bonds allowed soldiers' pay to keep pace with rising prices. (Curiously, the President of Harvard College, Samuel Langdon, also had his pay linked to this index.) With no explanation, an act in 1786 ended the experiment with indexed bonds.

Shiller explains that this historic episode is a good example of the role of economic theory in financial innovation. "John Maynard Keynes is widely quoted as asserting that most economic innovations derive ultimately from some 'academic scribblers.' But, in fact, in the case of indexed bonds, there was no academic precursor." He adds,
"It seems here that necessity was the mother of this invention. The example of the creation of indexed bonds in Massachusetts in 1780 appears to deny the importance of the “academic scribblers” that Keynes extolled, for the invention appeared long before the scholars wrote about it. And yet, in another sense, it only reinforces their importance, for the practice of indexation of bonds did not take hold at that time. It is a reasonable supposition that the indexed bonds did not continue because there was no well-conceived model that would justify and explain them."
Certain developments in index number theory, for example, did not take place until the twentieth century. A simple price index like the one used on the 1780 bond has what is now a well-known problem. If the price of one of the goods rises, consumers can shift some of their consumption to other goods. Because of the ability to substitute, the increase in the price index is more than the increase in the true cost of living. Irving Fischer proposed a solution in 1922.

It wasn't until later in the twentieth century that inflation-indexed government bonds reappeared. This time around, academic scribblers abounded. The UK was a much earlier adopter than the US. On the recommendation of the Wilson Committee Report of 1980, then Chancellor of the Exchequer Geoffrey Howe announced the Government's intention to issue index-linked gilts.

Other countries, including Canada, Sweden, and New Zealand, followed in subsequent years. Whereas the high inflation in the Revolutionary War prompted inflation-indexed government debt, the high inflation in the US in the late 1970s did not have the same effect, at least not immediately. Shiller became one of the academic scribblers, coauthoring "A Scorecard for Indexed Government Debt" with John Campbell in 1996. Their scorecard came out in favor of creating inflation-indexed government debt. TIPS were introduced in 1997, and have since grown as a share of debt and of GDP (see figure below).
Source: Campbell, Shiller, and Viceira 2009
Campbell and Shiller enumerated multiple potential upsides and downsides to TIPS in their 1996 report. I plan to delve into these in future posts (perhaps at Noahpinion, where I've been guest blogging lately).

(Since I'm writing about finance, I should add the disclaimer that this is not intended to be investment advice.)

Monday, September 9, 2013

Capital is Back: Wealth Ratios over Several Centuries

This afternoon I attended a seminar called "Capital is Back: Wealth-Income Ratios in Rich Countries 1700-2010" by Thomas Piketty and Gabriel Zucman. From the abstract:
"How do aggregate wealth-to-income ratios evolve in the long run and why? We address this question using 1970-2010 national balance sheets recently compiled in the top eight developed economies. For the U.S., U.K., Germany, and France, we are able to extend our analysis as far back as 1700. We find in every country a gradual rise of wealth-income ratios in recent decades, from about 200-300% in 1970 to 400-600% in 2010. In effect, today’s ratios appear to be returning to the high values observed in Europe in the eighteenth and nineteenth centuries (600-700%). This can be explained by a long run asset price recovery (itself driven by changes in capital policies since the world wars) and by the slowdown of productivity and population growth...Our results have important implications for capital taxation and regulation and shed new light on the changing nature of wealth, the shape of the production function, and the rise of capital shares."
The authors put together a new macro-historical data set on wealth and income, available online, which is "the first international database to include long-run, homogeneous information on national wealth...It can be used to study core macroeconomic questions – such as private capital accumulation, the dynamics of the public debt, and patterns in net foreign asset positions – altogether and over unusually long periods of time."

They suggest that from the interwar period until the 1870s, asset prices were depressed. Then an asset price recovery was driven by changes in capital policies. A U-shaped history of wealth-income ratios is more pronounced for Europe than for the US (Figure 4).

The following two figures show the changing nature of national wealth in the UK (Figure 3) and the US (Figure 10). (The picture for France is quite similar to the UK.) Agricultural land accounted for a staggering 400% of national income in 1870 in the UK, and is basically negligible now. The picture for the US changes if you include slaves as wealth in the antebellum period (Figure 11).

The author also decompose the accumulation of national wealth from 1970-2010 into a saving-induced wealth growth rate and a capital-gains-induced wealth growth rate for eight rich countries (Table 4). Germany is the only country to have experienced a negative capital-gains-induced wealth growth rate.
In Figure 16, below, Piketty and Zucman make a variety of assumptions to compute and simulate the worldwide private wealth to national income ratio from 1870-2100. The ratio bottomed-out in 1950, and they predict that it will continue to rise. This means, they suggest, that wealth inequality is likely to matter more now than in the postwar period, and will continue to matter even more in the future, raising a new set of issues about capital regulation and taxation.


Wednesday, September 4, 2013

Japanese Wage Data Not All That Spectacular (Exception: Finance Industry)

The results of Japan's Provisional Report of Monthly Labour Survey for July 2013 are now available. The Wall Street Journal calls the wage data "not all that gloomy," citing the fact that nominal earnings are up 0.4%. According to the article,
"That’s good news for Prime Minister Shinzo Abe as he has made wage growth a key measure of success for Abenomics, which seeks to lift Japan out of 15 years of deflation. While the aggressive monetary easing and government spending measures have pushed up production as well as prices, Mr. Abe has acknowledged that without substantial wage growth, there can be no sustainable economic expansion."
I think it's too early to claim good news or to call this substantial wage growth. Here are just a few quick points from my skim-through of the survey results. The 0.4% increase that the article refers to is for nominal total cash earnings (compared to the same month a year ago), for all industries. This can be broken down into a 0.3% fall in contractual cash earnings and a 2.1% increase in special cash earnings. Companies are giving summer bonuses but not committing to presumably more permanent base-pay increases.

Both the contractual and special cash earning changes vary a lot across industries. In the finance and insurance industry, total cash earnings were up 1.5% and special cash earnings were up 17.8%. On the other extreme is the education and learning support industry, for which total cash earnings were down 6.1% and special cash earnings were down 20.1%.

The total real wage is down 0.4% from the same month a year ago. On a seasonally-adjusted basis, the number of regular employees has neither increased nor decreased. If any readers are adept at interpreting this survey data, please chime in with any insights I have missed.

I believe my earlier post--"What Does Abenomics Feel Like?"-- is still quite relevant.


Sunday, September 1, 2013

Limited Time Offer! Temporary Sales and Price Rigidities

Even though prices change frequently, this does not necessarily mean that prices are very flexible, according to a new paper by Eric Anderson, Emi Nakamura, Duncan Simester, and Jón Steinsson. In "Informational Rigidities and the Stickiness of Temporary Sales," these authors note that it is important to distinguish temporary sales from regular price changes when analyzing the frequency of price adjustment and the response of prices to macroeconomic shocks.
"The literature on price rigidity can be divided into a literature on "sticky prices" and a literature on "sticky information" (which gives rise to sticky plans). A key question in interpreting the extremely high frequencies of price change observed in retail price data is whether these frequent price changes facilitate rapid responses to changing economic conditions, or whether some of these price changes are part of “sticky plans” that are determined substantially in advance and therefore not responsive to changing conditions.  
We use an exceptionally detailed dataset on retail and wholesale prices to investigate these questions. Our dataset has the advantage of providing accurate administrative measures both of the Regular Retail price and of the retailer’s marginal cost—i.e., the Base Wholesale Price. We find that temporary sales are unresponsive both to movements in the Base Wholesale Price and to movements in underlying production costs..." 
They provide some interesting institutional features of temporary sales and promotions:
"Due to the logistical complexity of holding successful temporary sales and associated promotional activity, manufacturers and retailers jointly set a schedule for temporary sales – a promotion calendar – through an annual planning process. This means that temporary sales follow sticky plans...Wholesale price drops associated with trade deals typically do not represent commensurate drops in the retailer’s marginal cost, since the retailers is “spending down” a finite trade deal budget.  
We believe that there are two other notable institutional features of trade deal budgets. First, the most common way that manufacturer trade deal budgets are determined is via accrual accounts, which are analogous to frequent flyer accounts. Just as consumers accumulate “miles” when they fly on, say, United Airlines, retailers accrue funds in a manufacturer trade deal budget for the total volume purchased from a manufacturer. Second, payment from the manufacturer budget to the retailer is typically contingent on execution of a trade deal. Retailers typically receive money after there is verification of a price discount, in-store signage or advertising of the manufacturer’s project."
They conclude that regular (non-sale) prices exhibit stickiness, while temporary sale prices follow "sticky plans" that are relatively unresponsive in the short run to macroeconomic shocks:
"Our analysis suggests that regular prices are sticky prices that change infrequently but are responsive to macroeconomic shocks, such as the rapid run-up and decline of oil prices. In contrast, temporary sales follow sticky plans. These plans include price discounts of varying depth and frequency across products. But, the plans themselves are relatively unresponsive in the near term to macroeconomic shocks. We believe that this characterization of regular and sale prices as sticky prices versus sticky plans substantially advances an ongoing debate about the extent of retail price fluctuations and offers deeper insight into how retail prices adjust in response to macroeconomic shocks."